
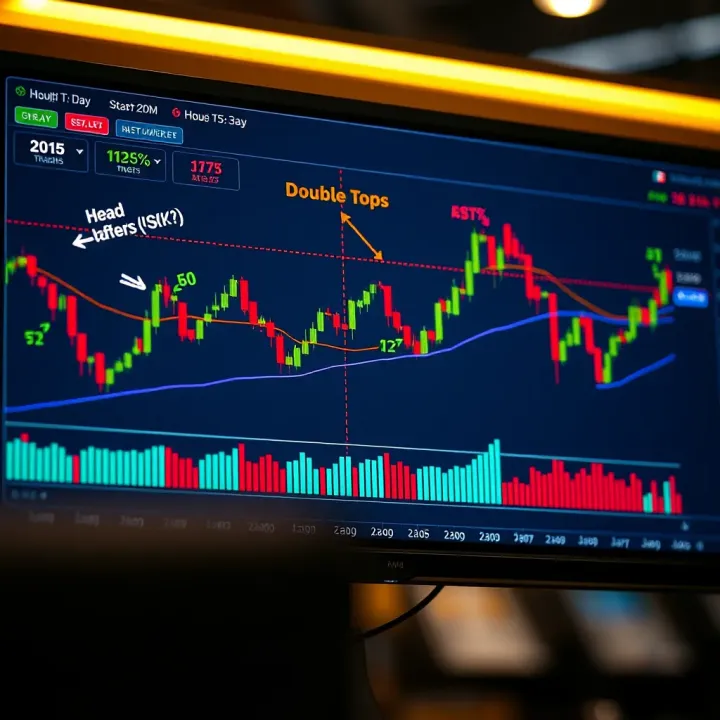
Understanding Chart Patterns: Practical Guide for Traders
📈 Learn key chart patterns for smart trading decisions in SA. This practical PDF guide offers clear tips on spotting trends and interpreting local market moves.
Edited By
Sophie Langley
Chart patterns form an essential part of technical analysis, offering visual clues about possible price movements. These patterns represent the collective behavior of buyers and sellers, often signalling trend continuation or reversal. Understanding them can give you an edge in timing entries and exits more effectively.

Pattern Formation: Look for distinct shapes or formations created by price bars or candlesticks over time. Examples include triangles, head and shoulders, and double tops/bottoms.
Volume Confirmation: Patterns confirmed by volume changes tend to be more reliable. For instance, a breakout accompanied by a spike in volume is often a stronger signal.
Time Frame Matters: Patterns on daily charts may provide different implications compared to those on hourly or weekly charts. Align your analysis with your trading horizon.
Patterns don’t predict the future, but they provide a framework to interpret price movements and probabilities based on historical behavior.
A few examples illustrate this well:
The ascending triangle often suggests buyers are gaining strength, setting up for a potential rising breakout.
A head and shoulders pattern usually indicates a market top and signals a reversal to the downside.
Double bottoms typically show strong support levels where prices have tested and reversed, hinting at a possible bullish move.
To get the most from chart patterns, combine them with other indicators like moving averages or Relative Strength Index (RSI). This layered approach reduces false signals and sharpens your trading decisions.
Bottom line, chart patterns are practical tools — when you learn to recognize their shape, volume context, and position within trends, your market analysis gets more actionable and grounded. Keep practicing to spot these patterns under real market conditions; it’s a skill that develops over time and directly impacts your trading success.
Chart patterns are essential tools that help traders visualize potential price movements by analyzing historical price data. They offer a roadmap, showing where the market might head next based on recognizable shapes formed on price charts. For example, a "head and shoulders" pattern often signals a trend reversal, helping traders position themselves accordingly. Without understanding these patterns, traders might miss critical signals or react late, risking losses.
Chart patterns are formations created by the price action of stocks, commodities, or other financial assets over time. These shapes—such as triangles, flags, or double tops—reflect repeated behaviors of buyers and sellers within the market. Each pattern has unique characteristics that hint at whether the current trend will continue or reverse. For instance, an ascending triangle typically points to a bullish breakout, suggesting traders should watch for buying opportunities.
Traders use chart patterns to simplify complex market data and make informed decisions quickly. Instead of guessing which way the price might move, they look for these trusted patterns that have historically signified specific outcomes. For example, swing traders often pair pattern recognition with volume analysis to confirm whether a breakout is genuine or likely to fail. This reliance isn't blind faith; it's about stacking probabilities in their favor.
Behind every pattern lies a battle between supply and demand. When buyers outnumber sellers, prices rise; when sellers dominate, prices fall. Chart patterns visually capture these tug-of-wars. Take a double bottom pattern — it forms when the market hits a support level twice, unable to fall further due to rising demand. This shows traders that buyers are stepping in, potentially pushing prices higher.
Humans tend to follow herd behavior, reacting similarly to certain price levels or news. This collective psychology is what shapes chart patterns. For instance, a "flag" pattern appears after a sharp price move when traders pause to catch their breath, reflecting temporary indecision before the trend continues. Recognizing these behaviors helps traders anticipate market moves rather than react after the fact.
Familiarity with chart patterns not only improves timing but also aids in risk management by highlighting when the market might shift gears.
The bottom line is that understanding chart patterns gives traders an edge by translating crowd psychology into easy-to-read visual clues. This practical insight is indispensable, whether you trade stocks, options, or forex.
Reversal patterns are a critical part of technical analysis because they hint when a prevailing trend is likely to change direction. For traders, spotting these patterns early can translate to significant gains or help prevent losses. Mastering common reversal patterns gives you a practical edge by signaling potential shifts before they’re widely recognized. Let's look at some key reversal patterns that every trader should identify and understand.
The Head and Shoulders pattern is made up of three peaks: a taller peak (the "head") flanked by two smaller peaks (the "shoulders"). These peaks align around a neckline, which acts as a support level. When the price breaks below this neckline, the pattern confirms. Recognizing this structure helps you anticipate a bearish reversal from an uptrend.

This pattern signals that the buying momentum is weakening and sellers are stepping in. After the breakdown below the neckline, traders often expect the price to drop similarly to the distance from the head’s peak down to the neckline. It's a reliable indication that bulls are losing control.
Wait for a clear close below the neckline before entering a short position. Volume often increases as the neckline breaks, offering additional confirmation. Setting a stop-loss just above the neckline protects against fakeouts. Also, measure the pattern’s height to set realistic profit targets.
Double tops and double bottoms feature two distinct peaks or troughs at roughly the same price level. For a double top, these peaks suggest strong resistance, whereas double bottoms indicate solid support. The price test of these levels twice shows the market’s hesitation in continuation.
The key signal is the break away from the support or resistance level between the two peaks or troughs, called the neckline. For a double top, a drop below the neckline confirms a bearish reversal. For a double bottom, a rise above the neckline confirms a bullish turn.
Wait for the price to close beyond the neckline before entering a trade. For double tops, short positions open upon breakdown; for double bottoms, long positions enter after breakouts. Set stop-losses slightly beyond the peaks or troughs, and take profit levels can be estimated by the pattern height projected from the neckline.
Triple tops and bottoms extend the double versions with a third peak or trough at similar levels. This pattern shows even stronger resistance or support. Confirmation comes when the price finally breaks the middle neckline — the horizontal level between the extremes.
The triple test indicates persistent rejection at a certain price, making a breakout or breakdown more reliable. It often occurs before significant trend reversals. Traders treat triple patterns as powerful signals due to the repeated test of market limits.
Bottom line: Common reversal patterns like head and shoulders, double and triple tops or bottoms give practical clues about when trends might falter or reverse. Spotting these patterns and applying clear confirmation and risk management rules can meaningfully improve your trading decisions.
Continuation patterns are key tools traders use to confirm that an existing trend will likely carry on. They help you avoid jumping the gun on reversals and instead stick with what the market shows. The big advantage lies in their ability to signal that price action is simply taking a breather before resuming its course. Recognizing these patterns gives you a better edge in timing entries and exits without second-guessing.
Flags generally look like small, rectangular shapes slanting against the prevailing trend, almost like a miniature correction. Think of them as tight price channels moving sideways or slightly against the trend following a sharp price move. Pennants differ—they're like small symmetrical triangles where the price converges sharply as buying and selling pressure balance out on a shorter timeframe. Both patterns pop up after a strong price surge or drop and represent brief pauses rather than full reversals.
These patterns reflect market indecision but with a tilt toward continuing the trend. For example, a bull flag appears after a robust upward move and shows the price consolidating within parallel lines, often on lower volume. This signals sellers aren't overpowering buyers, and the trend still favors gains. Traders should observe volume shrinking during consolidation, followed by a spike at breakout, confirming renewed momentum.
Trading flags and pennants focuses on waiting for confirmation—a breakout beyond the pattern with decent volume. Jumping in too early during the consolidation risks fakeouts. Setting entry orders slightly above the flag’s upper boundary (in an uptrend) offers a cleaner signal. Stop-losses can sit just below the consolidation zone since a move back inside could invalidate the pattern. Using these patterns with momentum indicators like RSI improves reliability.
Triangles come in three flavors, each hinting at slightly different market moods. A symmetrical triangle forms when price action creates lower highs and higher lows, converging evenly. This suggests balance and buildup before a decisive breakout. Ascending triangles feature a flat resistance line with rising lows, implying buyers are gaining strength. Descending triangles flip this—with a flat support line and falling highs—showing sellers pushing pressure.
Symmetrical triangles usually break out in the direction of the prior trend but aren’t guaranteed; their balanced shape means a trader has to watch closely for where volume surges. Ascending triangles tend to break upwards, reflecting buyer dominance, while descending triangles often break down. Volume tends to drop as the triangle tightens, then spikes dramatically on the breakout.
Patience is key with triangles. Place buy or sell orders just outside the pattern’s border to catch the breakout without chasing price prematurely. Because false breakouts can happen, it helps to combine triangle patterns with other signals like moving averages or volume confirmation. For example, if an ascending triangle breaks out while the stock price clears a 50-day moving average, that reinforces the bullish case.
Continuation patterns like flags, pennants, and triangles don't guarantee outcomes but provide solid clues. Using them thoughtfully can sharpen your trading timing and help you ride trends more confidently.
Less common chart patterns might not pop up every day but knowing them can give you an edge when they do appear. These patterns often signal more subtle market moves, helping you spot shifts before they become obvious. For example, the Cup and Handle or Rounding Bottom patterns tend to form over longer time frames, which means they hint at steady, sustainable trends rather than quick flips. This makes them valuable for swing traders or investors who prefer a more measured approach.
Formation process
The Cup and Handle pattern starts with a rounded bottom formation that looks like a “U” or a bowl—this is the cup. It shows a period where prices drop, then gradually climb back to the prior high. After the cup forms, the handle develops as a short consolidation, usually moving sideways or slightly downward. This handle represents hesitancy or profit-taking before a breakout.
This pattern is useful because it suggests the market has absorbed selling pressure and is ready for an uptrend. An example is when a stock like Microsoft forms this pattern over a couple of months, showing resilience before resuming its upward momentum.
Bullish implications
The classic takeaway from a Cup and Handle is bullish continuation. Once price breaks above the handle's resistance, it often confirms buyers are back in control, and the trend should rise. The breakout’s volume tends to increase, supporting the pattern's validity.
For real-world trading, this means you might place a buy order just above the handle’s resistance with a stop loss below the handle’s low to manage risk. This setup can lead to solid gains if the breakout holds.
Practical trading insights
Traders should watch volume closely; low volume on the handle's formation followed by heavy volume on breakout is a strong sign. Avoid entering too early during the handle phase, as prices can dip, causing premature losses.
Also, the pattern works best on daily or weekly charts since shorter timeframes can give false signals. Like any pattern, confirm with other indicators such as moving averages or RSI to avoid getting caught in fake breakouts.
Appearance and timeframe
The Rounding Bottom, sometimes called the Saucer pattern, looks like a gentle, curved shape resembling a bowl. It forms when prices slowly decline, stabilize, and then gradually climb up again over weeks or months. Unlike sharp reversals, this pattern signals a slow shift in market sentiment.
For instance, a small-cap stock may trend lower for several weeks, flatten out, then ramp up slowly, creating this smooth curve. Investors who spot this early can position themselves for a gradual but steady upward trend.
How they signal gradual trend shifts
Because of their drawn-out nature, Rounding Bottoms tell a story of waning selling pressure and returning buying interest. This slow-motion change often leads to sustained rallies rather than quick spikes.
When the price finally moves above the high point preceding the bottom phase, it can indicate that the trend is reversing. Traders use this breakout as a signal to enter or add to positions, expecting steady gains rather than volatile moves.
These less common patterns demand patience but can reward traders with strong signals about where the market is headed next. Watching them closely alongside other tools can enhance your trading strategy's reliability.
Chart patterns can be powerful tools for traders, but using them successfully requires more than just recognition. To make the patterns work for you, it's key to combine them with other technical tools and avoid common mistakes. Doing so sharpens your analysis and improves your chances for profitable trades.
Volume analysis gives critical insight when confirming chart patterns. A pattern breakout accompanied by increased volume often signals strong commitment from traders, making the move more reliable. For example, a bullish breakout from a cup and handle pattern with rising volume suggests actual buying pressure, rather than just a temporary price spike. Watching volume helps you weed out false breakouts, which often occur on light volume.
Moving averages smooth out price action and reveal trend direction, complementing pattern analysis. A pattern forming near a key moving average like the 50-day or 200-day can carry more weight. Say a double bottom forms right above the 200-day moving average—it could mean added support, reinforcing the bullish potential. On the flip side, if prices break below moving averages after a pattern, it may hint at a failed signal.
Indicators to confirm signals include tools like the Relative Strength Index (RSI) or Moving Average Convergence Divergence (MACD). These help gauge momentum and confirm if the price is overbought or oversold during a pattern formation. Suppose an ascending triangle breakout is paired with an RSI rising from oversold territory; that alignment boosts confidence in the pattern's validity. Relying on just the pattern alone without such indicators increases risk.
Overtrading based on patterns alone is a common trap. Seeing a familiar pattern can create a rush to act, but not every pattern leads to a successful trade. Without confirming signals or proper risk management, you might jump into too many trades, draining capital fast. It pays to wait for clear breakouts, confirm with volume and indicators, and set stop losses to guard against sudden reversals.
Ignoring market context can also derail your trades. Patterns don’t form in a vacuum; broader trends, news events, and economic conditions matter. For instance, a bullish pattern in a weak overall market might not follow through. Traders who watch the bigger picture—like prevailing trend direction or earnings reports—make better calls. Ignoring these factors can turn promising patterns into costly mistakes.
The bottom line is that chart patterns work best when they're part of a well-rounded strategy. Blend them with volume, moving averages, and indicators, and always consider the wider market landscape to trade smarter and safer.
📈 Learn key chart patterns for smart trading decisions in SA. This practical PDF guide offers clear tips on spotting trends and interpreting local market moves.

📊 Understand common chart patterns and how to trade them with confidence. Learn to spot bullish and bearish signals for better market decisions in South Africa and beyond.

📈 Learn how to spot forex reversal candlestick patterns and improve your trading strategy. Expert tips for South African traders to predict market shifts with confidence.

Boost your trading skills with clear candlestick pattern guides 📈. Learn key signals, interpret charts confidently, plus get practical PDFs for SA traders 🇿🇦.
Based on 8 reviews